As China's internationalization moves forward, the domestic printing industry is facing increasing pressure. Fine prints are subject to severe challenges. Choosing the right method to control image quality will undoubtedly allow companies to take a new step in a short period of time.
First, the PDCA method.
l Concept
   The PDCA method is the "Plan", "Do", "Check", "Action" (referred to as "PDCA") management model. It is a system in the ISO14001 certification management standard organized and promulgated by the International Organization for Standardization (ISO) in 1996. The most important feature of the ISOl400l standard is to change passive management to active management and change mandatory management to moderate management, emphasizing self-discipline and self-improvement.
2, PDCA law attention problems and tendencies
(1) Quality and price are related
(2) The randomness of quality standards
(3) Quality tolerance
(4) Quality depends on the input
3. Implementing the PDCA law in printing companies can produce the following effects:
(1) From the perspective of the environment associated with the ISOl400l standard, the PDCA method can enable printing companies to fundamentally reduce pollution; effectively control pollution sources in activities, achieve emission standards for pollutants, and reduce the impact on the environment; The environmental performance of the product reduces the impact of the product on the environment during manufacture or use; reforms processes and materials to reduce the impact on the environment during the production process; transform or update equipment to reduce the impact on the environment; pay attention to the classification and recycling of waste ;
(2) Reduce the consumption of energy and resources Strengthen the management of energy consumption and material consumption, realize energy saving and consumption reduction by reforming technology and equipment, reduce risks and save environmental expenses;
(3) Improve the market competitiveness of enterprises; improve corporate image and increase market share; increase market share through high-quality performance of the product; reduce costs and improve the market competitiveness of the company;
(4) Improve the management level of the company and the quality awareness of all employees. Improve the competitiveness of companies and their products in the market and promote international trade.
Second, the image QC seven methods
QC is Quality Control. QC's seven techniques are commonly used statistical management methods. It mainly includes seven QC tools: layer method, platonic method, characteristic factor graph method, inspection table method, histogram method, scatter diagram method, and control chart method.
(a), layer method
1, concept
   The layered approach is to group data collected under the same conditions of the same nature for comparative analysis.
Because in the printing process, there are many factors that affect the quality of the changes, if you do not distinguish these obstacles, it is difficult to draw the law of change. Data stratification can be performed in a variety of ways according to the actual situation. For example, the color layer method uses the diversity and distinctiveness of color as the criteria for classification and debate. For example, posts such as weddings and wedding invitations are red, and postings for funeral events are white.
2, the classification method
In image quality control and implementation methods, we have used two kinds:
1, 4M layer method, according to different staff (Man), according to the type of printing equipment (Machine), according to the printing method (Method), according to the printing of raw material composition (Material) layers.
2, 2T layer method, according to the printing time (Time), according to the temperature during the printing process (Temperatuer.) layer.
3, the application of layer method
(1) The layer method should be used before collecting the image quality evaluation data.
If you do not plan well before recording your data, you often find that you must waste a lot of energy and time to classify the collected data, and make another statistic work, which is time-consuming and laborious. Therefore, before collecting data, you should consider the conditional background of the data, tier it, and start collecting.
(2) Making good use of layers is the foundation for other QC techniques.
Through the following study of other QC methods, we will find that the Plato method, the inspection table method, the histogram method, the scatter diagram method, and the control chart method must all be used as the layering method based on the problem or cause of discovery. For example, when making Plato, if too many items are set or the proportion estimated in other columns of the setting item is too high, the center of gravity of the problem is not known. This is the cause of the layer defect; the bimodal or high prototype of the histogram is There are layers of problems.
(b) Plato method
1, concept
Plato method is based on the collected data, according to the reasons for the error, status, location, customer opinion, security incident classification, and according to the frequency of occurrence to determine the problem and solution. It is a tool to analyze and find the main factors that affect quality.
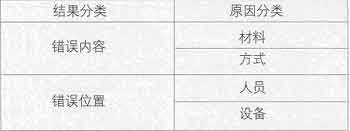
The printing process is complex and each step can have an impact on image quality. However, customers have high quality requirements for printed matter. For printing companies, only by summing up mistakes and actively improving can they be invincible in the printing industry. When using the Platonic method, we can classify the results of images that appear in printed matter, and the reasons can be classified as follows:
2. The steps of analysis using the Platonic method;
(1) For matters to be disposed, layer by result or reason.
(2) Determine what the axis represents. The vertical axis can indicate the number of accidents. The horizontal axis indicates statistical items.
(3) Determine the starting time and ending time of data collection as the basis of Plato's data, with the time limit as regular as possible.
(4) Record data and draw a histogram.
(5) Connect the cumulative curve.
(C), characteristic factor map method
l Concept
   The so-called characteristic factor map, the causal analysis diagram, is the many causes that will cause a certain result, and is illustrated in a systematic way, and uses graphs to express the relationship between results (characteristics) and causes (factors).
The characteristic factor map of the printing industry is used to analyze the relationship between the fluctuation of the print quality characteristics and its underlying causes, that is, a graph showing the relationship between the causes and results. We identify the fluctuations of quality characteristics (ie, major quality issues) by arranging graphs, that is, the objects that we want to improve, and then use the causality diagram to systematically organize the relevant personnel's experience against the identified quality characteristics (ie, results). By charting the language data, a variety of reasons that affect the main quality problems can be summarized in a simple and clear manner, and then the main causes can be found out.
2, the use of characteristic factor map method steps
(1) Each participant enlists the causes and countermeasures of a certain result
(2) Outline the reasons
(3) Explain the formation of each reason
(4) More detailed analysis of each reason
(5) Find out the key reason
(6) Determine the solution
3, the application of the characteristic factor map method
(1) Process Analysis
(2) Process Control
(3) Operation specification
(4) Quality replacement control
4. Some misunderstandings in the application process of characteristic factors
(1) The quality characteristics are too general. If the object of analysis is not specific, it cannot be analyzed in a targeted manner. For example, we can't just say "carry-cut failed," but should specifically mention what is unqualified, whether it is unqualified in size, is unsatisfactory in orderliness, or is unqualified in shape or position. Because the reasons for these problems are different.
(2) When multiple quality features are mixed on the same cause and effect map, one cannot see the causality. One cause and effect graph can only analyze one quality feature. Multiple quality features must draw multiple cause and effect maps.
(3) Some people mistakenly believe that the more causal factors are listed on the cause-and-effect diagram, the better. Therefore, all the reasons that have no actual influence or reasons unrelated to the quality characteristics are all included in the cause and effect diagram. In fact, authenticity alone will only increase the difficulty of analysis. The reason must be analyzed from the actual point of view.
(4) The main reasons are not marked and incomplete. After the main cause is identified by verification, a box should be drawn on the cause of the cause and effect map so as to be prominent and easy to find. In addition, the names of causal maps, names of attendees, dates, names of drafters, dates, names of organizations, and other related matters should be indicated, and then the causal map should be filed for future reference. Once similar quality issues arise, causal maps of the archive can be invoked for reference and analysis. Incomplete annotation may cause difficulties in the analysis.
(5) Some people mistakenly believe that as long as the situation is familiar, if one person closes the door, a cause and effect map can also be drawn. In fact, drawing a cause-and-effect diagram is a process of gathering the wisdom and experience of the masses. Through common discussions,
Bar And Beverage
Our range of bar tool is everything you need to start your home bar.
If you are an avid entertainer, you may probably own your bar at home ,our range of Bar Tools and wine tools are perfect to you for home entertaining.Moreover, our collection of bar tools are favoured by bartenders in the world's top saloons.
With quality bar tools and a diverse range, you'll be able to find your ideal bar tools in a flash.
Choose us, your smart choice!
Bartender Kit,Bartender Tools,Bar Utensils,Bar And Beverage Tools
Xiongyang Household Co., Ltd , https://www.xyknives.com